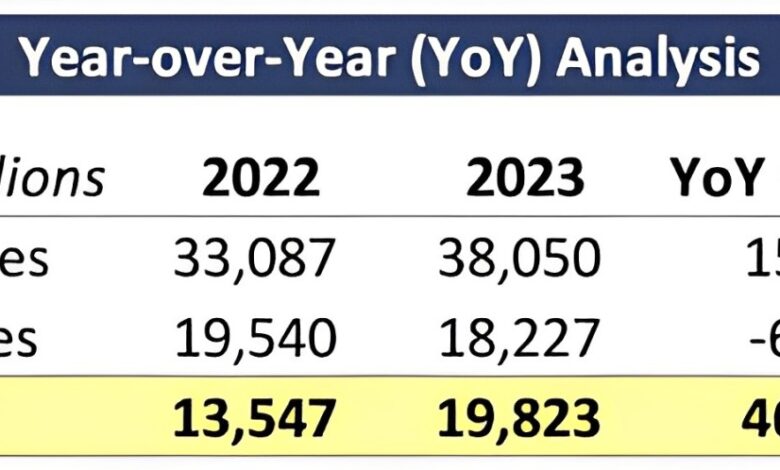
Unlocking YOY: The Ultimate Guide to Year-Over-Year Analysis

Table of Contents
- Introduction to YOY
- The Importance of YOY Analysis
- How to Calculate YOY
- 3.1 Basic Formula
- 3.2 Example Calculation
- 5.1 Financial Performance
- 5.2 Sales Metrics
- 5.3 Marketing Campaigns
Introduction to YOY
Year-over-year (YOY) analysis is a vital tool used by businesses, analysts, and investors to measure performance over a specific period. By comparing data from one year to the same data from the previous year, stakeholders can gain insights into trends, growth rates, and overall performance. This method helps to smooth out seasonal fluctuations, providing a clearer picture of progress and performance.
The Importance of YOY Analysis
YOY analysis serves as a powerful indicator of a company’s health. It allows organizations to track performance over time, assess strategic decisions, and make informed projections. Here are some key reasons why YOY is crucial:
- Trend Identification: YOY data reveals long-term trends that short-term metrics may obscure.
- Performance Benchmarking: Organizations can benchmark their performance against industry standards.
- Informed Decision-Making: YOY analysis provides data that helps in strategic planning and resource allocation.
How to Calculate YOY
Calculating YOY is straightforward, but understanding the formula is essential for accurate analysis.
Basic Formula
The formula for calculating YOY growth is:
[
\text{YOY Growth} = \left( \frac{\text{Current Year Value} – \text{Previous Year Value}}{\text{Previous Year Value}} \right) \times 100
]
Example Calculation
Let’s say a company had $1,000,000 in revenue in 2022 and $1,200,000 in 2023. To calculate the YOY growth:
[
\text{YOY Growth} = \left( \frac{1,200,000 – 1,000,000}{1,000,000} \right) \times 100 = 20\%
]
This 20% increase indicates robust growth and suggests positive momentum in the company.
Interpreting YOY Results
Interpreting YOY results is critical for understanding business performance. Different YOY outcomes can signify various business conditions.
Positive YOY Growth
A positive YOY growth rate suggests that a company is improving over time. This can be due to:
- Increased Demand: Higher customer demand can drive sales growth.
- Market Expansion: New markets or product lines may contribute to revenue increases.
- Improved Efficiency: Cost-cutting measures and improved operational efficiency may lead to better profit margins.
Negative YOY Growth
Conversely, negative YOY growth may indicate challenges such as:
- Decreased Sales: A drop in sales could stem from various factors, including increased competition or market saturation.
- Economic Downturn: Economic conditions can impact consumer spending and business investment.
- Operational Issues: Internal problems, such as production delays or supply chain disruptions, can also lead to declining performance.
Common Applications of YOY
YOY analysis is applicable across various sectors and can be employed in numerous ways.
Financial Performance
In finance, YOY metrics are essential for evaluating a company’s fiscal health. Investors often look at YOY growth in revenue, net income, and earnings per share (EPS) to gauge a company’s profitability and growth potential.
Sales Metrics
For sales teams, YOY analysis helps assess the effectiveness of sales strategies. Metrics such as YOY sales growth or customer acquisition can provide valuable insights into performance.
Marketing Campaigns
Marketers can use YOY analysis to evaluate the success of campaigns. By comparing the effectiveness of different marketing strategies from year to year, businesses can optimize their efforts and allocate resources more effectively.
Best Practices for YOY Analysis
To maximize the effectiveness of YOY analysis, consider these best practices:
- Consistency: Use the same data sources and methods for calculations to ensure comparability.
- Context: Provide context for the numbers by considering external factors, such as economic conditions or industry trends.
- Visual Representation: Utilize charts and graphs to illustrate YOY trends effectively.
- Cross-Referencing: Complement YOY analysis with other metrics for a more comprehensive view.
Limitations of YOY Analysis
While YOY analysis is a powerful tool, it has its limitations:
- Seasonality: Certain industries may experience significant seasonal variations that YOY analysis could obscure.
- Short-Term Focus: YOY comparisons may not capture longer-term trends or shifts in business strategy.
- Data Quality: Poor data quality can lead to misleading conclusions. It’s vital to ensure that the data used is accurate and relevant.
Conclusion: Harnessing the Power of YOY
In summary, YOY analysis is a crucial element in assessing business performance. By understanding its calculations, applications, and interpretations, stakeholders can make informed decisions that drive growth and success. Whether you’re a business owner, investor, or analyst, mastering YOY will empower you to navigate the complexities of financial performance and strategic planning. Embrace the power of YOY and unlock new opportunities for growth!
you may also read choicegazette.


